Your personalized program: calculate calorie deficit for weight loss, BMI, TDEE, and macros with the Mifflin-St Jeor equation.
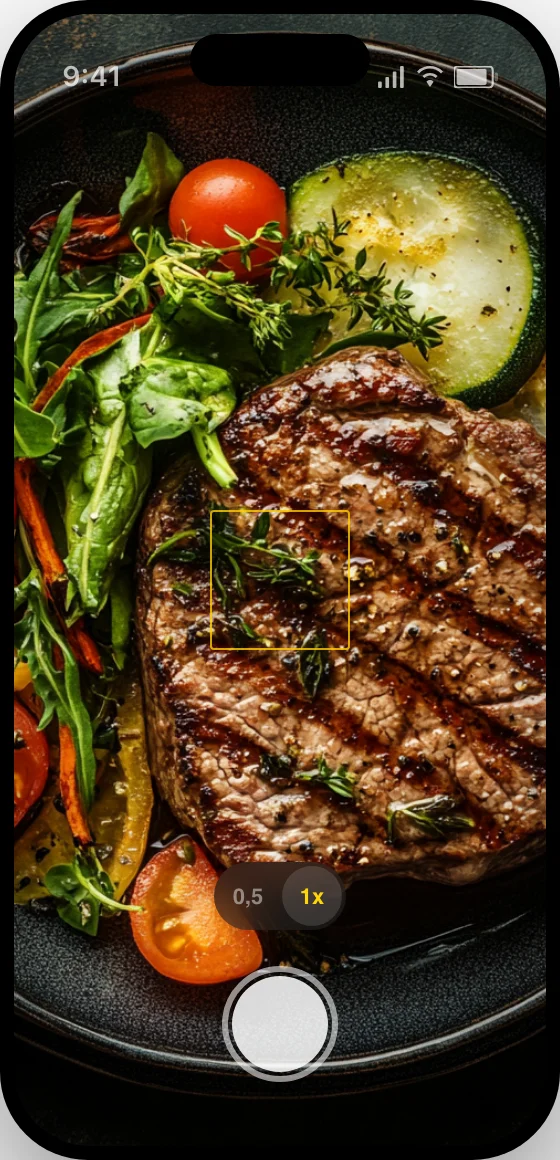
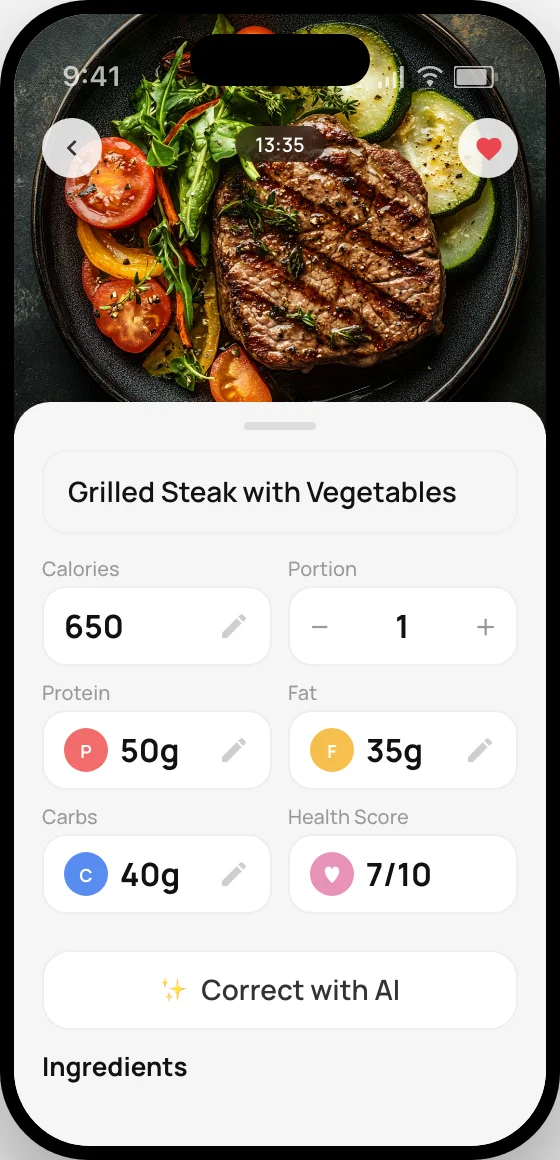
Just snap a photo of your food — CalZen recognizes it instantly and tracks your calories, macros, water, and more.
This calculator uses the Mifflin-St Jeor equation (1990) to estimate your Basal Metabolic Rate (BMR) — the number of calories your body needs at complete rest. It then multiplies your BMR by an activity factor to determine your Total Daily Energy Expenditure (TDEE).
The Mifflin-St Jeor equation was found to be the most accurate predictive equation for healthy individuals in a systematic review of 18 studies by Frankenfield et al., published in the Journal of the American Dietetic Association (2005). It predicts resting metabolic rate within 10% of measured values in more subjects than any other equation.
| Formula | Equation | Accuracy |
|---|---|---|
| Mifflin-St Jeor (default) | 10×W + 6.25×H - 5×A ± s | Most accurate (ADA) |
| Harris-Benedict (revised) | 13.4×W + 4.8×H - 5.7×A + 88.4 (M) | Tends to overestimate |
| Katch-McArdle | 370 + 21.6×LBM | Best for athletes (needs body fat %) |
Body Mass Index (BMI) is a measure that assesses whether your weight is proportional to your height. It's calculated as weight (kg) / height (m)². BMI is used by the WHO and doctors worldwide as a primary screening tool for weight-related health risks.
| Category | BMI | What it means |
|---|---|---|
| Underweight | < 18.5 | Possible nutrient deficiency, weakened immune system. Medical consultation recommended. |
| Normal | 18.5–24.9 | Optimal range. Lowest weight-related health risks. |
| Overweight | 25–29.9 | Increased risk of cardiovascular disease and type 2 diabetes. A moderate calorie deficit can help. |
| Obese | ≥ 30 | Significantly elevated risk. A doctor-supervised weight loss plan is recommended. |
BMI doesn't account for muscle mass, age, or fat distribution. Athletes with developed musculature may have an elevated BMI. For a more accurate assessment, use body fat percentage.
The USDA Dietary Guidelines for Americans (2020-2025) provide estimated calorie needs by age, sex, and activity level:
| Age | Women (sed./mod./active) | Men (sed./mod./active) |
|---|---|---|
| 19-25 | 2,000 / 2,200 / 2,400 | 2,400-2,600 / 2,800 / 3,000 |
| 26-30 | 1,800 / 2,000 / 2,400 | 2,400 / 2,600 / 3,000 |
| 31-50 | 1,800 / 2,000 / 2,200 | 2,200 / 2,400 / 2,800 |
| 51-60 | 1,600 / 1,800 / 2,200 | 2,200 / 2,400 / 2,600 |
| 61+ | 1,600 / 1,800 / 2,000 | 2,000 / 2,200 / 2,600 |
For safe weight loss, the CDC recommends losing 1-2 pounds (0.5-1 kg) per week through a calorie deficit of 500-1,000 kcal/day. Minimum safe intake: 1,200 kcal/day for women, 1,500 kcal/day for men (NHLBI).
Research consistently shows that people who track what they eat are significantly more successful at losing weight:
| Study | Finding | Source |
|---|---|---|
| Kaiser Permanente (2008) | People who kept daily food records lost 2× more weight | Am J Prev Med |
| Harvey et al. (2019) | Only 15 min/day of food logging needed for results | Obesity |
| Berry et al. (2021) | Digital self-monitoring = -2.87 kg significant weight loss | Obesity Reviews |
| Huntriss et al. (2024) | 50% of active users achieved 5%+ weight loss | Obesity Sci & Pract |
| AI-Assisted Tracking (2024) | 64% maintain changes vs 23% manual tracking | JMIR |
"Those who kept daily food records lost twice as much weight as those who kept no records."
— Jack Hollis, Ph.D., Kaiser Permanente
1. Mifflin MD, St Jeor ST, et al. Am J Clin Nutr. 1990;51(2):241-7. PubMed →
2. Roza AM, Shizgal HM. Am J Clin Nutr. 1984;40(1):168-182. PubMed →
3. Frankenfield D, et al. J Am Diet Assoc. 2005;105(5):775-789. PubMed →
4. USDA. Dietary Guidelines for Americans 2020-2025. dietaryguidelines.gov →
5. Harvey J, et al. Obesity. 2019;27(3):380-384. PubMed →
6. CDC. Losing Weight. cdc.gov →
7. NHS. Understanding Calories. nhs.uk →
Last updated: March 2026
Stop guessing calories. Snap a photo — CalZen AI counts everything for you. Calories, protein, carbs, fat — in seconds.
Quick reference — calories per 100g. Tap any food for full nutrition facts.
All values per 100g · Tap for full nutrition breakdown