Guessing portions is why your calorie deficit never works. CalZen's AI analyzes your food from a photo — accurate calories, protein, carbs, fat, and ingredients in seconds. Finally, tracking you can trust.
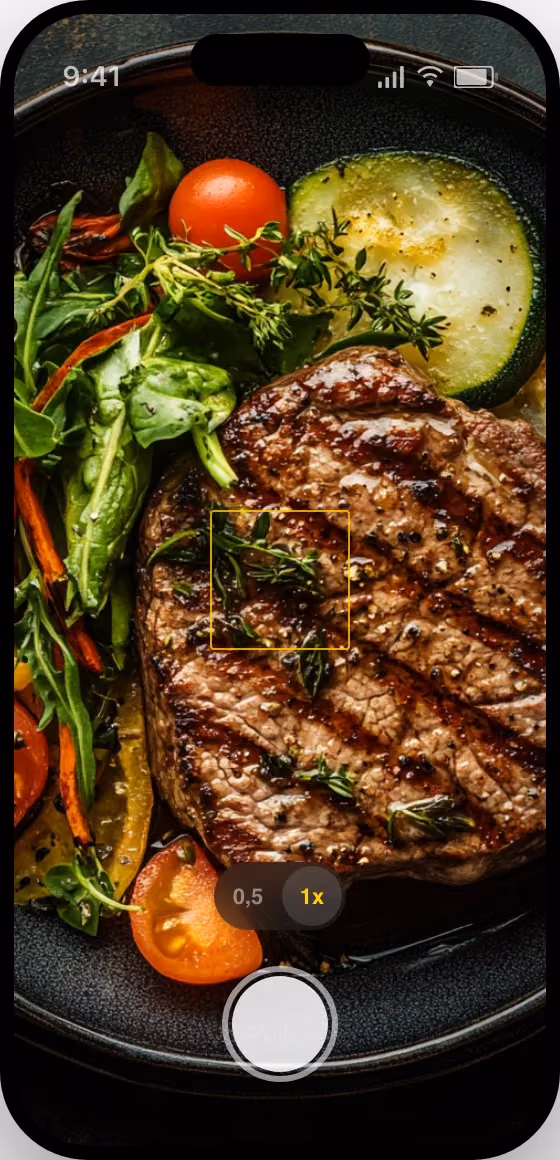

Over 80%1 of people quit calorie counting in the first week — because weighing every gram and searching food databases is exhausting. CalZen replaces all of that with one photo.
1 Health & fitness apps retain only 8–15% of users by Day 7 (AppsFlyer, 2025; Business of Apps, 2026).
CalZen shows your weight trend first — because that's what matters. Calories, macros, and activity all feed into one clear picture of your progress.
Different goals, one app. Here's what CalZen users say.
CalZen is the most advanced AI calorie tracker — everything to reach your goal, in one app.
Nine things people ask before they start tracking with CalZen.
1 AI models identify common food items with up to 90% accuracy (Rouhafzay et al., Frontiers in Nutrition, 2025; Khalili et al., Applied Sciences, 2025).
Join millions who stopped guessing and started seeing real results. One photo is all it takes.